Data taken from Top-Down Analytics (TDA) Research report: 2018 Outlook: Analytical Instruments Industry
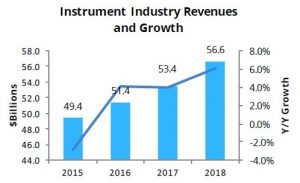
The global analytical instruments market grew a modest 3.9% in 2017 to reach $53.4 billion. With the recovery of some key end markets and the improved macroeconomic environment in the second half of 2017, the market is expected to thrive in 2018, which is good news for vendors. Overall growth of 6.1% is expected which will take the market to a value of $56.6 billion. However, some market segments will of course benefit from better growth than others.
Automation, microscopy and mass spectrometry are expected to be the top performers, with growth of 7.8%, 7.0% and 6.9% expected respectively.
The 2018 Outlook report from TDA provides a detailed overview of the 2017 performance and 2018 projections for all key instrument market segments and is a must-read for anyone involved in the industry. Here is our top line summary of key opportunities by segment.
Chromatography
- The technology segment’s 2017 revenues are estimated to be $10.8 billion, or 20% of the total revenues of the analytical instruments industry as a whole.
- Forecast to grow 6.4% to $11.5 billion in 2018, the chromatography market is projected to outperform the lab instruments market by 0.3 percentage points.
- Growth is linked to the resurgence of the chemical and oil & gas industries and increased confidence in academic funding in the US and Europe, plus advances in food and environmental science.
- Analytical HPLC is the largest of the chromatography technology segments, with 42% market share and 6.3% growth expected in 2018.
Mass Spectrometry
- 2017 market size is $4.2 billion, 8% of the total market for laboratory analytical instruments
- 6.9% growth is expected in 2018 to $4.5 billion.
- MS is a key technology in the omics field and plays a key role in applications such as food adulteration and authenticity analysis.
- Single quad LC/MS is expected to experience the most rapid growth in 2018 at 12.0%.
Automation
- Making up 7% of the total analytical instruments market, the 2017 market for automation technologies is estimated at $4.3 billion.
- 7.8% growth is expected in 2018, making automation the segment to experience the most dramatic increase in demand.
- Automation comprises five technologies and their associated products:
- Liquid handling
- Robotics
- Microplate readers and washers
- Multiplex and high-throughput and singleplex ELISA
- Lab informatics
- Each sub-technology is expected to outperform the lab instruments industry as a whole.
Lab equipment
- The total market in 2017 was estimated at $5.2 billion and is forecast to increase by 6.7% in 2018.
- The five product categories with the highest revenues within lab equipment are:
- Electrochemistry equipment
- Centrifuges
- Lab balances
- Water purification
- Extraction.
Life science instrumentation
- The market in 2017 was $12.8 billion, up from $12.0 billion in 2016.
- Growth of 6.0% is predicted in 2018 to $13.6 billion due to solid performance of the pharmaceutical industry and stabilised funding in the government and academic sectors in the US.
- DNA sequencers and other genetic analysis instruments both have 25% market share.
- Label-free detection, which has just 2% market share, is projected to show the most impressive growth at 8.7%, boosted by growth in pharma/biopharma.
Molecular spectroscopy
- Strong performance of the life science sector will drive demand for products from the molecular spectroscopy segment.
- The market is expected to grow to $4.0 billion in 2018, an increase of 4.8%.
- Strong demand forecast for UV/Vis products in the environmental / food sectors.
- Increase in projected pharma R&D, particularly in biopharma.
Atomic spectroscopy
- The market in 2017 was estimated at $3.4 billion and is projected to reach $3.5 billion in 2018, a modest growth of 2.5%.
- XRF has the largest market share – 29% of the total segment – and is expected to grow 3.9% in 2018.
- With a market share of 18%, the XRD market is expected to undergo 2.5% growth, thanks to small but stable growth in microelectronics.
Microscopy
- Currently estimated at $6.7 billion, the microscopy segment is forecast to expand 7.0% in 2018, making it the second best performing segment in the industry.
- Growth is powered in part by strong demand from Asia and solid growth across multiple application sectors.
- Valued at $3.3 billion in 2017, wide-field microscopy is the largest technology category
- The confocal market is the microscopy segment forecast to expand the most in 2018, by 8.0%.
Materials analysis
- The 2017 total market for materials analysis is $2.5 billion, having fallen by almost 1%.
- The market is expected to grow to $2.6 billion, an increase of 3.9% in 2018.
- The market for physical testing instruments comprises 29% of the total materials analysis segment and is expected to grow 3.7% in 2018, buoyed by demand for industrial applications.
- Among the materials analysis technologies, the particle characterisation category, which accounts for 17% of the market is forecast to post the most impressive growth, at 5.3%.
- The expected rise in value of the market for particle characterization products in 2018 will be due to rapid growth of the nanotechnology and energy/battery sectors.
Furniture and enclosures
-
- Furniture and enclosures are foundational elements of wet labs. Sales of these products are tied to the construction of new labs, lab expansions and product replacement.
- 4.8% increase in demand projected in 2018 from 2017’s $1.4 billion market.
- The US is the largest geographical market for lab furniture, however, the fastest growing is China.
Process Analytical Instrumentation
- PAI technologies are used for on-line measurements in a wide variety of industries, including chemicals, petroleum, water and wastewater treatment and pharma.
- Demand for PAI has dropped since 2015 to about $3.7 billion, but the market is forecast to turn around, growing 5.6% in 2018 to $3.9 billion.
- Photometers and spectrometers are expected to show the strongest growth in market demand in this segment in 2018, increasing by 7.3%.
Making the most of market insight
This kind of market insight is invaluable to marketers. Not only is the historical data incredibly useful in determining what share of the market you might have vs your competitors for benchmarking, but the projections help validate your marketing plans. Putting dollar values against market growth in your segment, and thus monetising the growth you are aiming for, will help you to secure resources and investment and evaluate the success of your activities throughout 2018.
We work closely with clients in many of the segments outlined in the report to better communicate with their complex audiences to grow awareness, change perceptions, generate demand and ultimately, grow market share.
To buy the full report, click here.
To find out more about communicating with laboratory markets, contact us.


